
Two IP Blind Spots That are Impeding Companies’ ROI
分析
8月 24, 2026

Ask most intellectual property (IP) executives how their portfolio is performing and you’ll get a confident answer about size – how many patents, how many families and across how many jurisdictions. Ask which specific assets earn their keep, or how a competitor’s portfolio has shifted in the last 18 months, and the confidence drops rapidly.
That’s not a knowledge problem. It’s a visibility problem. And it shows up in two places at once.
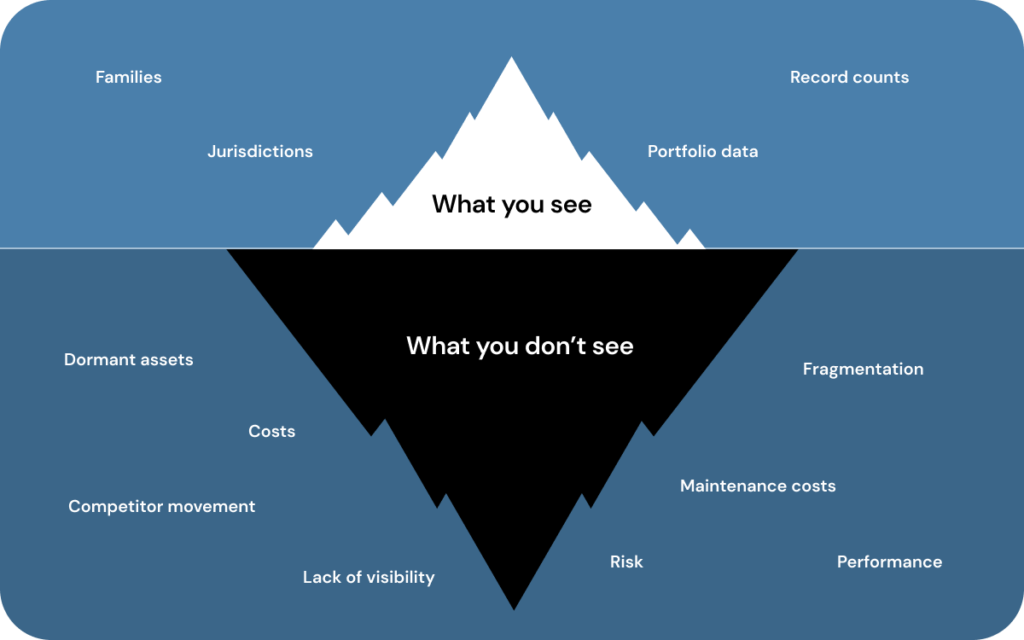
Blind Spot One: You Don’t Fully See Your Own Portfolio
Most portfolios grow the same way. Filing decisions are made years ago. Renewal cycles run on autopilot. Prosecution spend is approved because it was approved last year. Over time, the portfolio becomes less a strategic asset and more a collection of historical decisions nobody has revisited.
The costs show up quietly. Maintenance and annuity fees continue on patents that no longer align with the business. Outside counsel spend varies widely by firm and jurisdiction with little consistent oversight. Dormant assets sit unreviewed for years, tying up budget that could fund new filings in areas that actually matter to the company today and over the next decade.
None of this happens because IP teams are careless. It happens because the data needed to make different decisions – cost, performance, business relevance and risk, among other factors – usually lives in separate systems, spreadsheets and law firm reports that were never designed to talk to each other. Without a connected view, “review the portfolio” becomes a quarterly fire drill instead of an ongoing discipline.
Blind Spot Two: You Don’t See Where Competitors Are Moving
The second blind spot is less discussed but arguably more dangerous: most companies have limited visibility into how competitor portfolios evolve in real time.
Patent filings are one of the earliest public hints of where a competitor is investing R&D – often years before a product launch or market entry. A shift in filing activity toward a new technology area, a sudden increase in a specific jurisdiction or a wave of acquisitions in an adjacent space – each tells a story about where a competitor believes the future is headed.
Most IP teams see only fragments. Someone notices a competitor filing in a legal database search. A business unit flags a new competitor’s patent that looks uncomfortably close to its own roadmap. But this information rarely gets captured, tracked or connected back to internal portfolio strategy in any systematic way. The result is that competitive filing activity – one of the most concrete leading indicators available – is underutilized because the information was discovered too late to be strategic.
Why These Two Blind Spots Are Actually One Problem
It’s tempting to treat internal portfolio visibility and competitive landscape visibility as separate initiatives. One is often viewed as an operational fix, while the other a strategic nice-to-have. In practice they’re the same underlying problem, IP decisions get made without a complete picture.
A portfolio review that only looks inward can tell you an asset is expensive to maintain. It can’t tell you whether that same technology area is one where three competitors just ramped up filing activity – which might make the asset far more strategically important than its cost alone suggests. Conversely, competitive intelligence without a clear view of your own portfolio’s cost and coverage is just interesting information.
The teams getting real strategic value from their IP function connect both views: what we have, what it costs, what it’s worth – set against what competitors are building, where and how quickly.
What Connected Visibility Actually Looks Like
In practice this doesn’t mean more dashboards for the sake of dashboards. It means a few specific shifts in how IP data is gathered, analyzed and consumed:
- Portfolio decisions grounded in current cost and performance data, not filing history. Instead of renewing by default, teams see cost and business relevance side-by-side, and make pruning or investment decisions based on where things stand today.
- Outside counsel and spend patterns are visible across the full portfolio, not firm by firm. When cost data is unified, inconsistencies in spending or performance across law firms and jurisdictions become obvious instead of buried in individual invoices.
- Competitive filing activity is treated as an input to strategy, not a background curiosity. Tracking where competitor portfolios are growing – by technology area, jurisdiction and pace – turns public filing data into a flag for where the market is headed.
- One picture, not several. Perhaps most important, connected visibility means IP leaders, business unit stakeholders and executives work from the same view of cost, coverage and competitive position – rather than each group holding a different fragment and drawing different conclusions.
Analytics Turns Visibility Into Intelligence
Visibility alone gets you a clearer picture. Analytics turns that picture into actionable intelligence.
Once cost, performance and filing data are unified, the more interesting question is what patterns emerge. Integrated patent analytics can surface which technology areas attract the most filing activity – inside your own portfolio and across competitors – long before that activity shows up in a product launch or an earnings call. It can flag portfolio overlap and whitespace, showing where you’re heavily invested in a crowded space and where you may be under-invested in an area competitors are quietly building out.
This is where the two blind spots genuinely converge. Analytics applied only to your own portfolio tells you where you’re spending. Applied across the competitive landscape as well, it tells you whether that spending lines up with where the market is actually moving – and where it doesn’t.
In practice that means:
- Portfolio benchmarking against competitors and peers, not just against your own historical filing patterns, so you know whether your coverage in a given technology area is ahead, behind or in line with the field.
- Trend detection across filing activity, citations and technology classifications, surfacing emerging areas of competitive investment before they become obvious.
- Overlap analysis that flags where your portfolio may be exposed or where a competitor’s growing footprint in a shared technology area warrants a closer look.
The IP teams pulling ahead aren’t simply seeing more. They’re seeing further and deeper – using analytics to turn a connected view of cost, performance and competitive filing activity into strategic decision making.
The Strategic Cost of Staying Fragmented
None of this is really about tools or dashboards. It’s about what decisions get made – and how quickly – when the full picture is finally visible. IP teams with connected visibility make the same decision proactively. That shift, more than any single feature or capability, separates an IP function that manages cost from one that actively shapes competitive advantage.
The portfolios that matter most over the next several years won’t just be the biggest. They’ll be the ones managed by teams who could see clearly – both inward and outward – while the decisions still mattered.