Determining Which Patents to Keep and Protect
Analytics | IP Cost Management | Patent Management
March 25, 2024

Updated on March 25, 2024.
How do you determine which IP assets to renew and which to abandon? The annuity decision making process is complex, risky, and always challenging for IP professionals. Ultimately, your annuity renewal decisions determine whether your patent portfolio protects your products, keeps your competitors at bay, and enhances your company’s competitive edge. I discuss several IP lifecycle decisions in this blog, and how our updated analytics report helps bring clarity to what can be the murky process of making patent annuity decisions.
There is no substitute for high quality internal patent information such as evaluations by subject matter experts, patent-to-product mapping, and competitive claim charting. Your internal patent assessments can and should be supplemented with external analytics to support your renewal decision-making.
Anaqua’s updated AcclaimIP™ Annuity Decision Report™ on AQX® helps patent portfolio managers solve the annuity decision conundrum. This report includes a real-time patent analytics dashboard to surface key data to help you make patent annuity maintenance and abandonment decisions.
The report is divided into ten sections covering key patent metrics, a claims analysis, prosecution history, family timeline, citation and rejection metrics, relative survivorship for national filings and EP validations, and much more.
Below, see just seven sections of the enhanced report that can transform making annuity decisions:
- Benchmark Key Patent Value Indicators
- View the Prosecution History of an Entire Patent Family
- How Good Are Your Patent Claims
- Get Insight into Prosecution Timeline
- Benchmark the Survivorship of Similar Patents
- Analyze Reverse and Forward Rejections
- Gain a Unique Perspective on Your Patent’s Strength
1. Benchmark Key Patent Value Indicators
Patent value indicators are commonly used by patent managers to support their IP portfolio strategy. The challenge is the time it takes to bring together all the value indicators into one place to make decisions and how to interpret them.
One of the new features in the Annuity Decision Report is an array of generally accepted patent value indicators which compares the patent of interest to a set of patents from the same class and roughly the same age. Now you not only know, for example, how long your claims are, but also, how your patent directly compares to closely related patents. If you are not an expert on patent value indicators, each benchmark is accompanied by an explanation of the benchmark and what it tells you.
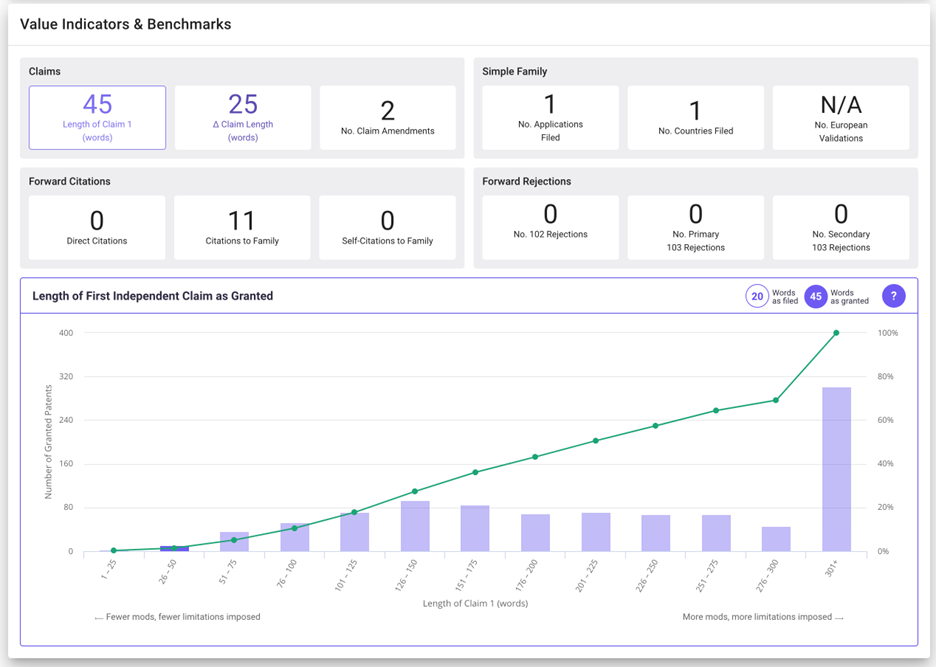
Figure 1: Value Indicators and Benchmarks in the AcclaimIP Annuity Decision Report
2. View the Prosecution History of an Entire Patent Family
Evaluating a patent without its prosecution history is challenging as most patents are prosecuted in multiple countries and by different examiners. Assembling this type of data manually can take hours. Additionally, when you have a large IP portfolio and are trying to make 1,000 decisions, it’s not feasible to gather and see all these data points holistically.
The Annuity Decision Report includes a timeline of all the patent family members, and the status of each patent. It provides key insights that are critical for making your renewal/abandonment decision.
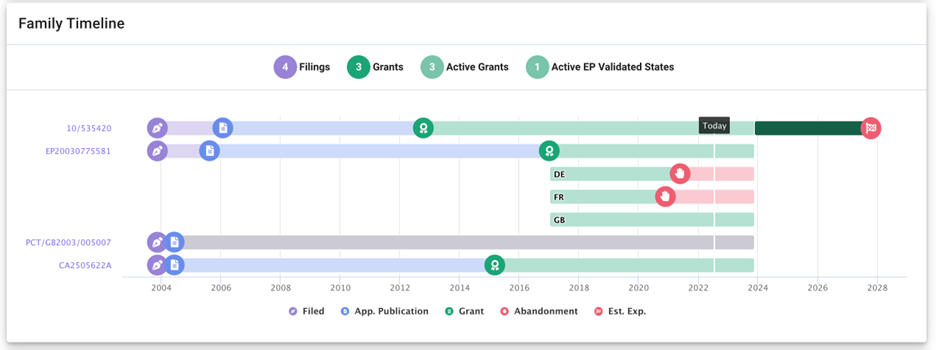
Figure 2: A family timeline such as this points out that it has already been abandoned in two European member states and has a significant PTA associated with the US case
For example, if your patent was examined in three jurisdictions, and granted in all three, then there is a good chance that the claims are valid—three separate examiners allowed the claims. However, if the opposite is true, then perhaps an examiner in one or more jurisdictions found prior art that could render the patent in question invalid.
Another example is a patent coming up for a $7,700 E3 US renewal might first appear to have just over a year of life left, but due to the Patent Term Adjustment (PTA) of almost 4 years, the remaining life of the patent may justify the $7,700 investment.
3. How Good are Your Patent Claims
Once you start reading claims and context of the prosecution and the amendments by examiners, you will never want to read standalone claims again. The claims analysis tool in the Annuity Decision Report compares the claims that were filed to the claims that were granted. It helps you to analyze claims of the patent faster and more accurately. It helps surface the questions you need to answer.
In the example below, you can clearly see that claim one was modified by adding new limitations which appear as green-underlined text. Did these changes significantly narrow the patent? Does your most recent patent review consider what was granted or what was filed?
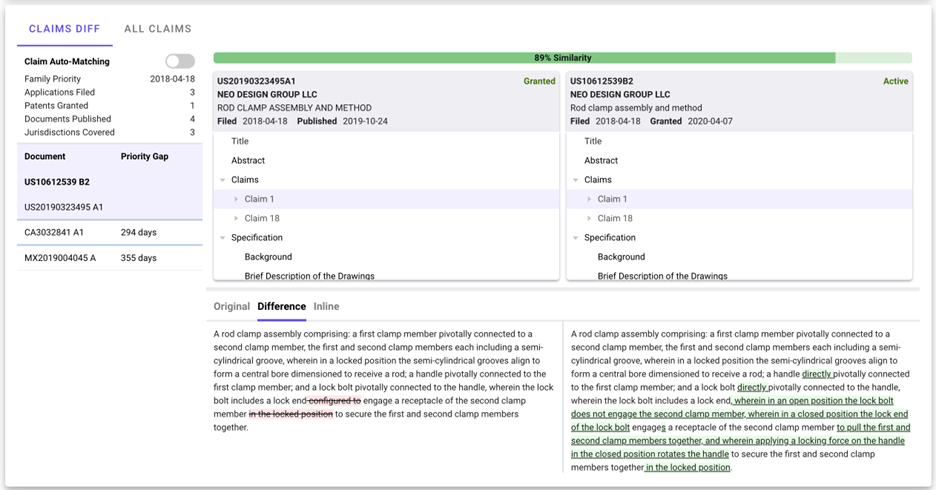
Figure 3: The claims analysis widget compares filed and granted claims as well as claims from all publications in the patent family
Claims can be analyzed across the entire patent family. In this example both the CA and MX counterparts were abandoned prior to grant which also raises some questions. This widget allows you to view and compare claims across the entire family.
4. Get Insight into Prosecution Timeline
One of the most powerful visualizations in the Annuity Decision Report is the Prosecution Timeline. Here you can clearly see this patent received two rejections (the red down-triangles), the first also containing a restriction. Claims were modified twice (blue up-triangles) before receiving a notice of allowance (NOA).
The power comes from the quick access to the examiner’s rejection arguments, and the cited art. By clicking the red triangles to see what art was overcome, and the blue triangles to see how the patent agent/attorney responded, you can determine if your patent is an incremental improvement on a competitive patent, which you may not be able to practice. You can also identify a patent that is truly unique and needs to overcome an obviousness or some other rejection.
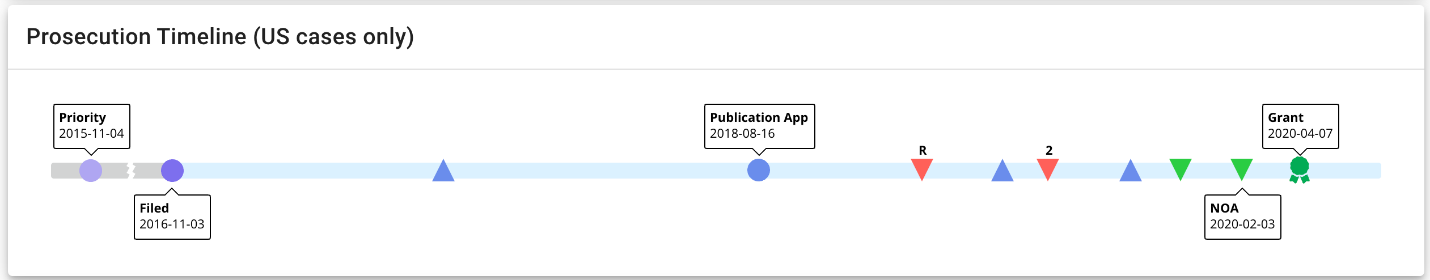
Figure 4: The prosecution timeline in the Annuity Decision Report
5. Benchmark the Survivorship of Similar Patents
Being able to track technology maturity and the lifetime value of a patent is essential to your overall strategy. In our Client Working Groups, our clients were looking at benchmarking the survivorship of similar patents by renewal year (or tranche for the US).
Our team then developed an interactive visualization showing how similar patents survive over time. In this example, we can see that similar patents fall off until about year twelve, where they appear to stabilize. In other words, if the patent survives to year twelve, it tends to survive full term.
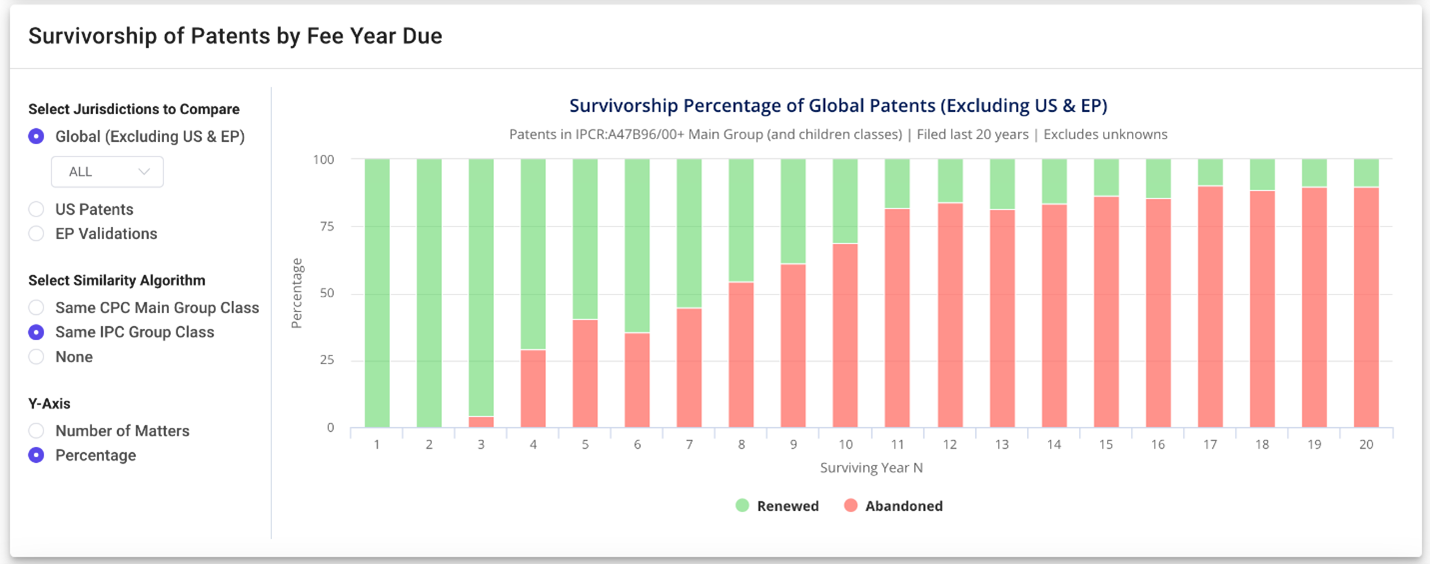
Figure 5: Survivorship of patents by year they are due in the Annuity Decision Report
The same visualization can be shown one country at a time, and special visualizations were developed to cover unique aspects of US and EP Validations.
6. Analyze Reverse and Forward Rejections
When making patent renewal decisions, backward rejections are just as critical as forward rejections. The quality and scope of your claims are directly related to the art that was overcome to receive your grant. The rejection snapshot in the Annuity Decision Report is enhanced to include both forward and backward rejections.
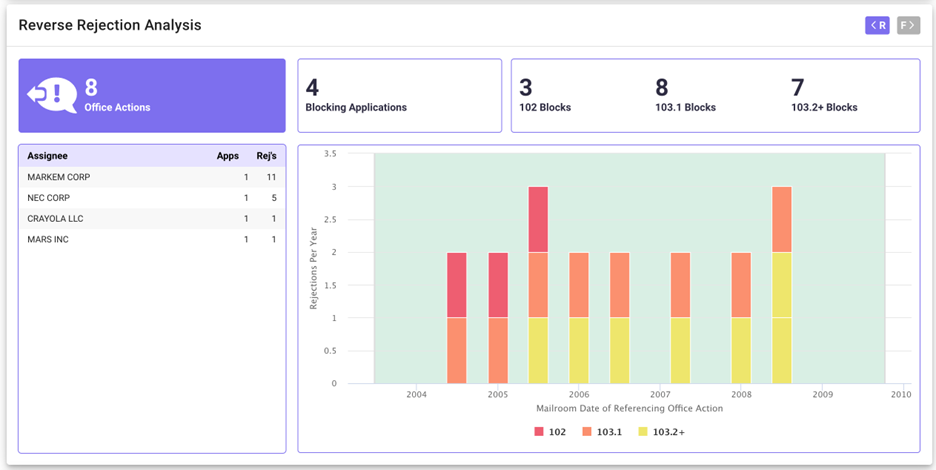
Figure 6: A reverse rejection analysis is equally important when evaluating your patent in context of the prosecution history and examiner rejections. The toggle flips back and forth between forward and backward rejection data.
7. Gain a Unique Perspective on Your Patent’s Strength
By identifying relevant prior art references, you can gain insights on patent’s strength, avoid potential infringement, and make informed annuity decisions.
The Known Uncited Prior Art Summary lists prior art references used by examiners in different jurisdictions across the patent family. It focuses on patents that were used in novelty or obviousness arguments in one jurisdiction but were not considered in the jurisdiction of the patent in question. Gain a unique perspective on the patent's strength and potential vulnerabilities to known prior art by using this tool in your annuity decision process.
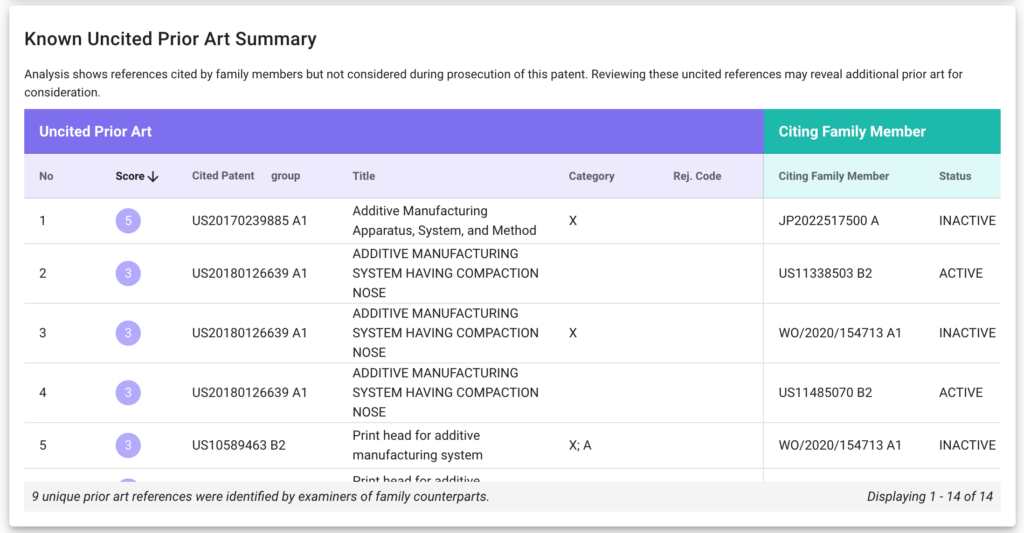
Figure 7: Gain a unique perspective on the patent's strength and potential vulnerabilities to known prior art
Conclusion
Patent portfolio managers no longer must spend hours trying to piece all this information together or reach a conclusion with limited data.
Developed in collaboration with Anaqua’s Client Working Groups, the AcclaimIP Annuity Decision Report gives you instant access to all data you need to make smart annuity decisions. Each widget within the report helps you answer the next question. The suite of analytics and visualizations in the report work together to give you everything you need to enhance your internal data to ensure you are building and maintaining the best possible patent portfolio within your given budget, which reduces the chances of uninformed or biased decision-making in maintaining your most valuable IP assets.
Make crucial annuity decisions faster with all the data and intelligence you need to explore in a single request!
Request a free report for a patent of your choice.
This report is now available on AcclaimIP™ software and through an AcclaimIP subscription fully integrated with the AQX® IP Management platform, and for AQX clients that license Anaqua’s Payment Services.

Written by Matt Troyer, Senior Director of Analytics Solutions
Further Reading